1. 内核 perf 架构
1.1 总览
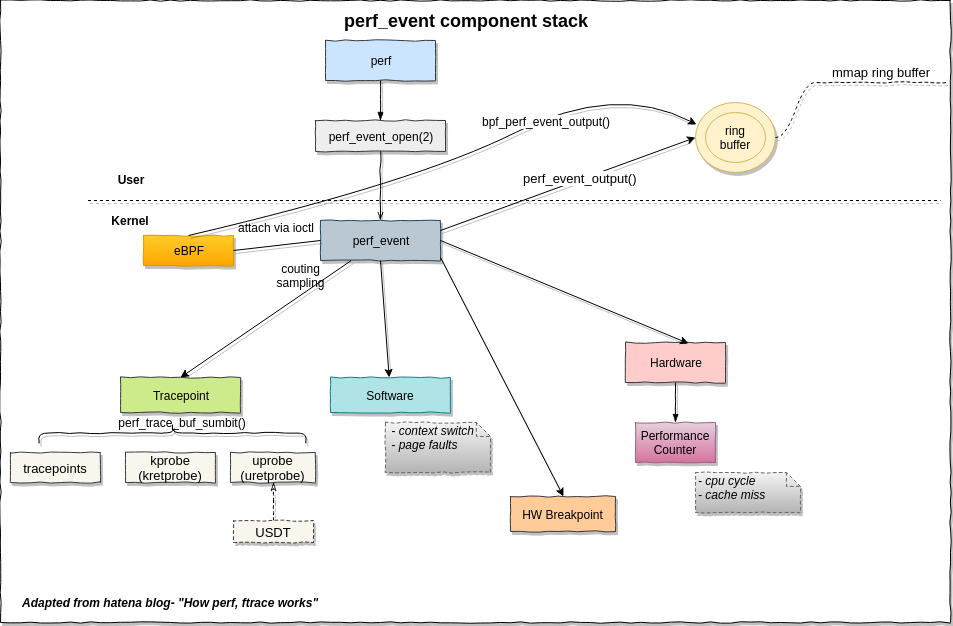
如果是写硬件计数器采样程序,涉及这幅图的软件、硬件事件,以及用户空间中的ring buffer.
如图所示,唯一的用户态系统调用perf_event_open(2)会返回一个perf事件的句柄。这样perf_event结构的信息可以用read/write/ioctl/mmap通用文件接口来操作。perf_event_open(2)的详细操作调用参数可以看perf_event_open(2) Linux manual page,后面写采样后台线程会用到。
如图所示,ring buffer也在用户态,perf_mmap()属于struct file_operations perf_fops负责把内核的环形缓冲区(ring buffer)映射到用户空间,让用户态程序零拷贝、无锁地直接读取采样数据。perf_mmap() 是 perf_event_open fd 的 mmap 回调,用户态直接 mmap 后读内存就能拿到 PMU 事件,无需 read() 系统调用。
perf_event_output()把采样数据写入 ring buffer 的核心函数。每次 PMU 溢出(事件发生n次时,记录第n+1次的信息)或软件事件触发时调用。
1.2 核心结构体
perf_event是内核中比较核心的结构体。常用属性分类:
| 类别 | 成员 | 说明 |
| :———– | :————————————— | :———————– |
| 事件身份 | u64 id | 全局唯一事件 ID |
| | struct perf_event_attr attr | 用户创建时的完整配置在perf_event_open系统调用中配置的各种,比如采样的事件、精细程度 |
| | enum perf_type_id type | 类型:硬件/软件/Tracepoint/Raw等 |
| 归属关系 | struct perf_event_context *ctx | 所属进程/CPU 上下文 |
| | struct perf_event *group_leader | 事件组组长 |
| | struct list_head group_entry | 组内链表节点 |
| 输出目标 | struct perf_buffer *rb | 指向 ring buffer(可共享,perf_event_set_output实现) |
| | struct perf_event *output | 输出重定向目标事件 |
| 调用栈 | struct perf_callchain_entry *callchain | 采到的内核/用户栈 |
| 时间戳 | u64 tstamp_enabled | 事件启用时刻 |
| | u64 tstamp_running | 实际运行时刻(扣除调度停用) | |
| 父子继承 | int parent | 是否继承给子进程 |
| | struct list_head child_list | 子事件链表 |
| 采样控制 | u64 sample_period | 采样周期(每多少事件采一次)用于自适应调整(频率限制) |
| | u64 last_period | 上次实际周期(自适应调整用) |
| | atomic64_t lost_samples | 丢样计数(buffer 满时) |
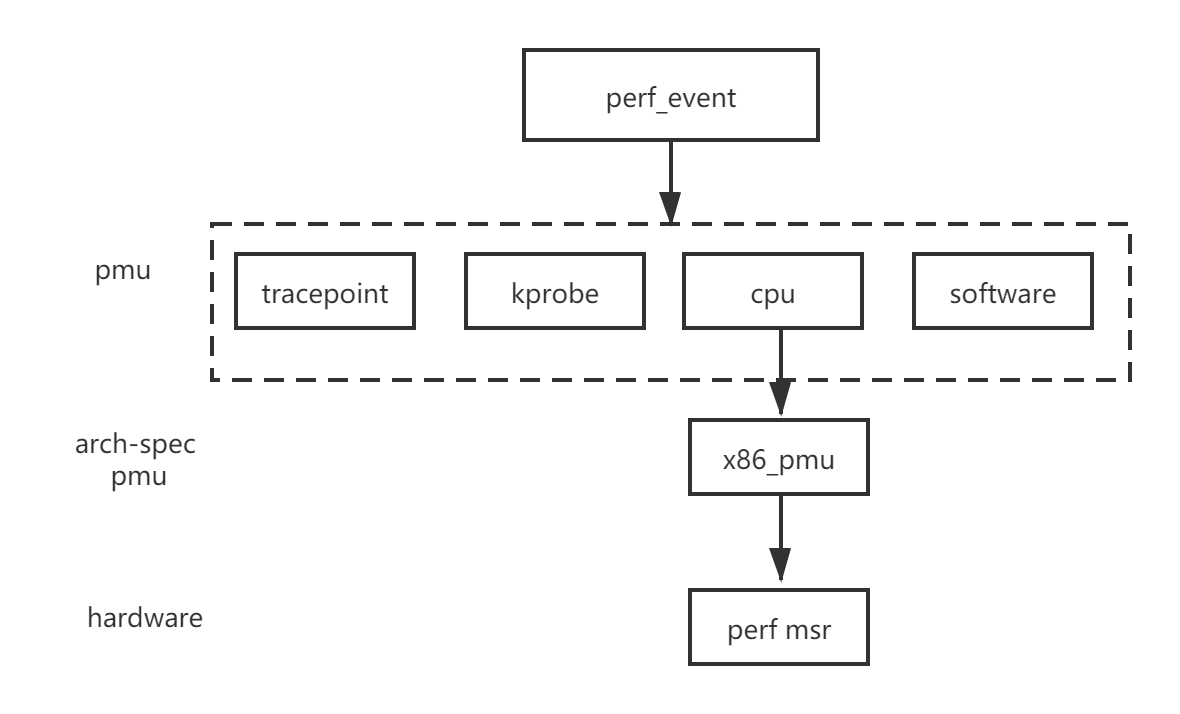
性能事件有多种类型,例如跟踪点struct trace_event *tp_event、软件struct sw_perf_event sw、硬件struct hw_perf_event hw。这些又具体表现为PMU结构体void *pmu_private,每一个事件都有一个,比如software pmu:
static struct pmu perf_swevent = {
    .task_ctx_nr	= perf_sw_context,

    .capabilities	= PERF_PMU_CAP_NO_NMI,

    .event_init	= perf_swevent_init,
    .add		= perf_swevent_add,
    .del		= perf_swevent_del,
    .start		= perf_swevent_start,
    .stop		= perf_swevent_stop,
    .read		= perf_swevent_read,
};如果这个事件是硬件相关,那么这个PMU结构体还会有一个和架构相关的结构体,如下图的struct x86_pmu, 这个硬件相关结构体的作用就是读或者写MSR性能监视器。
1.3 组织方式
perf event的组织方式是cpu维度或者task维度,这样采样才不是只有整个系统的。在manual page有写,perf_event_open()系统调用使用cpu、pid两个参数来指定perf_event的cpu、task维度。两种维度的关联是靠perf_event_context如下图:
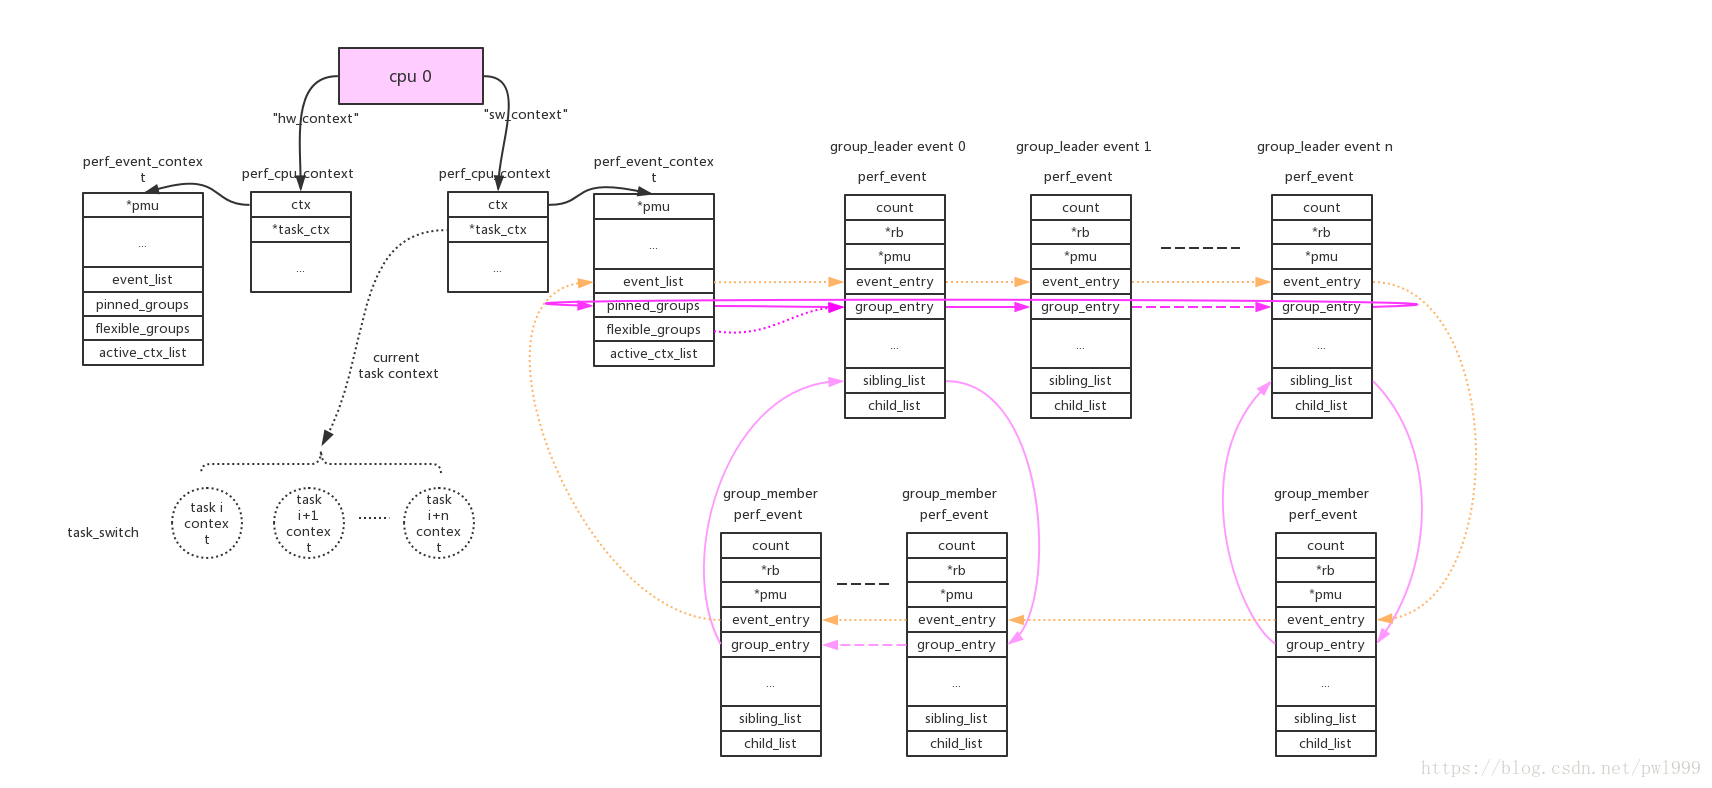
每个perf_event由event_list连接,而group的连接方式便于perf count功能一次性读出。
由于cpu维度的perf_event只要cpu online就会一直运行,task维度只有task被调度才会运行,这涉及perf驱动开关和任务调度。一个概括的函数调用图如下: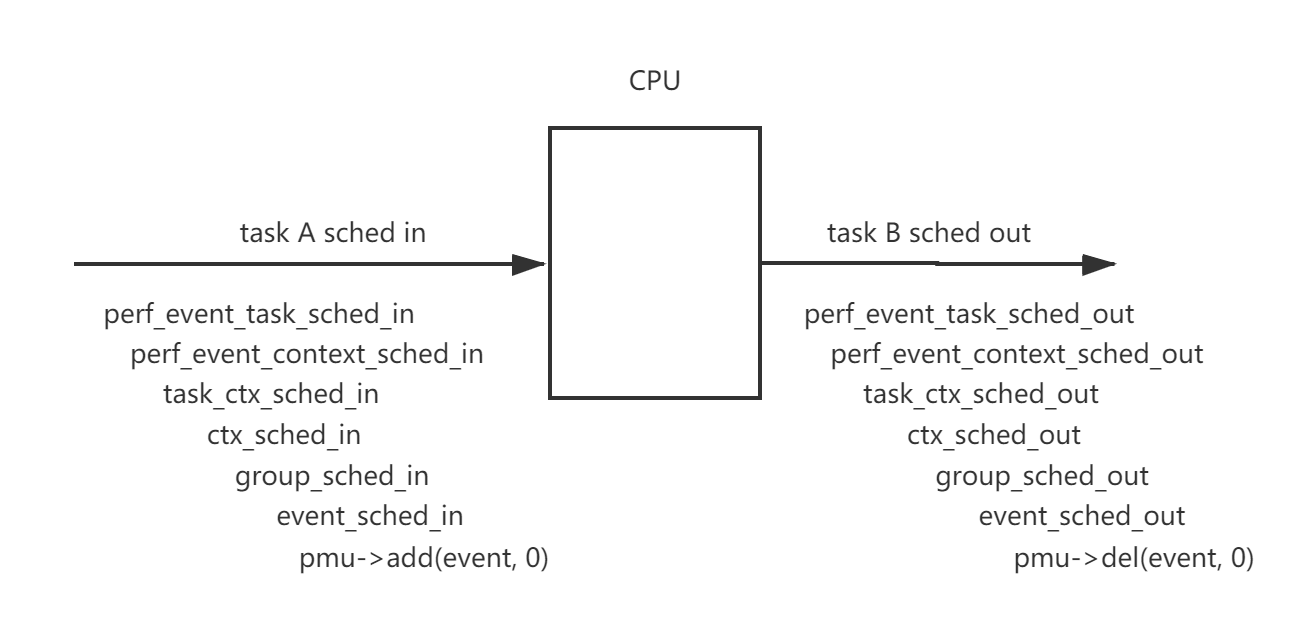
Every PMU is registerd by calling perf_pmu_register.
每个pmu拥有一个per_cpu的链表,perf_event需要在哪个cpu上获取数据就加入到哪个cpu的链表上。如果event被触发,它会根据当前的运行cpu给对应链表上的所有perf_event推送数据。

cpu维度的context:this_cpu_ptr(pmu->pmu_cpu_context->ctx)上链接的所有perf_event会根据绑定的pmu,链接到pmu对应的per_cpu的->perf_events链表上。
task维度的context:this_cpu_ptr(pmu->pmu_cpu_context->task_ctx)上链接的所有perf_event会根据绑定的pmu,链接到pmu对应的per_cpu的->perf_events链表上。perf_event还需要做cpu匹配,符合event->cpu == -1 || event->cpu == smp_processor_id()条件的event才能链接到pmu上。
参考Linux kernel perf architecture
参考Linux perf 1.1、perf_event内核框架
2. perf 计数器模式
perf_event_open()有两个使用模式,一个叫做计数,一个叫做采样。计数事件会统计发生的总数,采样事件会定期写入缓冲区。下面来看一个非常简单的计数的代码段,每一秒获取刚刚过去的那一秒内的指令数:
#include <stdio.h>
#include <string.h>
#include <stdint.h>
#include <unistd.h>
#include <sys/syscall.h>
#include <linux/perf_event.h>

//目前perf_event_open在glibc中没有封装,需要手工封装一下
int perf_event_open(struct perf_event_attr *attr,pid_t pid,int cpu,int group_fd,unsigned long flags)
{
    return syscall(__NR_perf_event_open,attr,pid,cpu,group_fd,flags);
}

int main()
{
    struct perf_event_attr attr;
    memset(&attr,0,sizeof(struct perf_event_attr));
    attr.size=sizeof(struct perf_event_attr);
    //监测硬件
    attr.type=PERF_TYPE_HARDWARE;
    //监测指令数
    attr.config=PERF_COUNT_HW_INSTRUCTIONS;
    //初始状态为禁用
    attr.disabled=1;
    //创建perf文件描述符,其中pid=0,cpu=-1表示监测当前进程,不论运行在那个cpu上
    int fd=perf_event_open(&attr,0,-1,-1,0);
    if(fd<0)
    {
        perror("Cannot open perf fd!");
        return 1;
    }
    //启用(开始计数)
    ioctl(fd,PERF_EVENT_IOC_ENABLE,0);
    while(1)
    {
        uint64_t instructions;
        //读取最新的计数值
        read(fd,&instructions,sizeof(instructions));
        //读取后清零,这样就不用手动去减了,否则会显示累计值
	    ioctl(fd,PERF_EVENT_IOC_RESET,0);
        printf("instructions=%ld\n",instructions);
        sleep(1);
    }
}
不需要任何的编译选项,直接gcc,然后运行(从上个图我们知道这是用户态的函数):
gcc single.c -o single
sudo ./single
对于多个计数器不能说搞多个文件句柄去读取,这样read()函数调用开销还是有点大的,重复利用一个句柄,这样就成了前面提到的组的关系。主要有以下6点不同。
#include <stdio.h>
#include <string.h>
#include <stdint.h>
#include <unistd.h>
#include <sys/syscall.h>
#include <linux/perf_event.h>

//目前perf_event_open在glibc中没有封装,需要手工封装一下
int perf_event_open(struct perf_event_attr *attr,pid_t pid,int cpu,int group_fd,unsigned long flags)
{
    return syscall(__NR_perf_event_open,attr,pid,cpu,group_fd,flags);
}

//1. 每次read()得到的结构体
struct read_format
{
    //计数器数量(为2)
    uint64_t nr;
    //两个计数器的值
    uint64_t values[2];
};

int main()
{
    struct perf_event_attr attr;
    // perf_event_attr structure provides detailed configuration information for the event being created.
    //————————————————————第一个计数器—————————————————
    memset(&attr,0,sizeof(struct perf_event_attr));
    attr.size=sizeof(struct perf_event_attr);
    //监测硬件
    attr.type=PERF_TYPE_HARDWARE;
    //监测指令数
    attr.config=PERF_COUNT_HW_INSTRUCTIONS;
    //初始状态为禁用
    attr.disabled=1;
    //2. 每次读取一个组
    attr.read_format=PERF_FORMAT_GROUP;
    //创建perf文件描述符,其中pid=0,cpu=-1表示监测当前进程,不论运行在那个cpu上
    int fd=perf_event_open(&attr,0,-1,-1,0);
    if(fd<0)
    {
        perror("Cannot open perf fd!");
        return 1;
    }
    //————————————————————第二个计数器—————————————————
    memset(&attr,0,sizeof(struct perf_event_attr));
    attr.size=sizeof(struct perf_event_attr);
    //监测类型
    attr.type=PERF_TYPE_HARDWARE;
    //监测时钟周期数
    attr.config=PERF_COUNT_HW_CPU_CYCLES;
    //初始状态为禁用
    attr.disabled=1;
    //3. 创建perf文件描述符,但是不同的是要传入上次的句柄
    int fd2=perf_event_open(&attr,0,-1,fd,0);
    if(fd2<0)
    {
        perror("Cannot open perf fd2!");
        return 1;
    }
    //4. 启用(开始计数),注意PERF_IOC_FLAG_GROUP标志
    ioctl(fd,PERF_EVENT_IOC_ENABLE,PERF_IOC_FLAG_GROUP);
    while(1)
    {
        struct read_format aread;
        //5.读取最新的计数值,每次读取一个结构体,每个计数器的读取和加入组的顺序是一致的。
        read(fd,&aread,sizeof(struct read_format));
        printf("instructions=%ld,cycles=%ld\n",aread.values[0],aread.values[1]);
        //6. 清空组内计数器
        ioctl(fd,PERF_EVENT_IOC_RESET,PERF_IOC_FLAG_GROUP);
        sleep(1);
    }
}
3. perf 文件句柄配置详解
从调用入口来看,传入的参数依次是要采样事件的宏定义,0这里值config2不用,第几个cpu,第几个perf event,进程的pid
/********************/
/*传入要采样事件的宏定义,config1=0,cpu个数,事件个数,pid(为0就监控所有);因为这里是在循环时open,每个cpu都有一个文件操作符在做这件事*/
/*******************/
static int __perf_event_open(__u64 config, __u64 config1, __u64 cpu,
	__u64 type, __u32 pid)
{
    struct perf_event_attr attr; // 函数需要的结构体,告诉这个文件描述符该怎么创建,因为采样不同的事件最后传回的perf_event结构体也不一样。

    struct file *file; // 已打开的文件在内核中用file结构体表示,文件描述符表中的指针指向file结构体。
    int event_fd, __pid; // 我们要接收的文件句柄

    memset(&attr, 0, sizeof(struct perf_event_attr));

    attr.type = PERF_TYPE_RAW; // 要检测的类型有硬件、软件等等咯。This indicates a "raw" implementation-specific event in the config field.
    attr.size = sizeof(struct perf_event_attr);
    attr.config = config; //要监测的采样事件
    /* 但是我们可以发现,这个事件传入的宏定义是自己定义的,不是系统有的默认的宏定义。If type is PERF_TYPE_RAW, then a custom "raw" config value is needed.  Most CPUs support events that are not covered by the "generalized" events.  These are implementation defined; see your CPU manual (for example the Intel Volume 3B documentation or the AMD BIOS and Kernel Developer Guide).  The libpfm4 library can be used to translate from the name in the architectural manuals to the raw hex value perf_event_open() expects in this field.*/
    attr.config1 = config1; // 这是用作扩展用的
    if (config == ALL_STORES)
		attr.sample_period = htmm_inst_sample_period; //采样事件间隔
    else
		attr.sample_period = get_sample_period(0);
    attr.sample_type = PERF_SAMPLE_IP | PERF_SAMPLE_TID | PERF_SAMPLE_ADDR; //采样目标IP寄存器、TID实际上是内核(线程)中可调度对象的标识符(当一个进程只有一个线程时,pid和tid总是相同的)、地址
    attr.disabled = 0; // 初始状态为启用
    attr.exclude_kernel = 1; /* don't count kernel */
    attr.exclude_hv = 1; /* don't count hypervisor */
    attr.exclude_callchain_kernel = 1; /* exclude kernel callchains */
    attr.exclude_callchain_user = 1; /* exclude user callchains */
    attr.precise_ip = 1; /* skid constraint,默认是2,要PEBS的详细信息必须为1 */
    attr.enable_on_exec = 1; /* next exec enables */

    if (pid == 0)
		__pid = -1;
    else
		__pid = pid;

    event_fd = sys_perf_event_open(&attr, __pid, cpu, -1, 0); //创建文件描述符
    if (event_fd <= 0) {
		return -1;
    }

    // 这里的读句柄的方式和上面计数用到的不一样。判断是不是写入到了文件,然后保留这个文件的private_data成员指针。private_data指针的指向会根据驱动不同而不同,这里可以获得perf_event指针。
    file = fget(event_fd);
    if (!file) {
		return -1;
    }
    mem_event[cpu][type] = fget(event_fd)->private_data;
    return 0;
}
4. perf 采样
如果机器只运行一个程序,那么使用计数的方式也是可以的吧。但是如果要在多个里面追踪一个进程或特定的core那就得采样了,而且采样的好处在于可以获得更多的信息。
采样的模板主要在于:1、采样需要设置触发源,也就是告诉kernel何时进行一次采样;2、采样需要设置信号,也就是告诉kernnel,采样完成后通知谁;3、采样值的读取需要使用mmap,因为采样有异步性,需要一个环形队列,另外也是出于性能的考虑。通过轮询或者响应信号判断是否采样完这一轮。
5. ring buffer
环形缓冲区的头是struct perf_event_mmap_page,记录共享环形缓冲区的特点,这个头大小是一个页面大小。
struct perf_event_mmap_page {
    ……
    /* --- 硬件计数器直接读取区 --- */
    __u32   lock;              /* seqlock,保证读一致性 */
    __u32   index;             /* 硬件计数器编号,0=不可用 */
    __s64   offset;            /* 软件累计值,加到硬件读数上 */
    __u64   time_enabled;      /* 事件启用的时间戳 */
    __u64   time_running;      /* 实际运行的时间(扣除调度停用)*/

    /* --- 绝对字节偏移量,从数据区起始开始的累计计数;单调递增,永不回绕(靠取模映射到环形缓冲区) --- */
    __u64   data_head;         /* 内核写的位置(只读,内核更新)*/
    __u64   data_tail;         /* 用户读的位置(用户更新,内核读)*/

    /* --- 能力标志与配置 --- */
    __u64   data_offset;       /* 数据区相对头页的偏移(通常=页大小)*/
    __u64   data_size;         /* 数据区总大小(字节)*/

      /* --- 用户态环形缓冲区控制 --- */
    __u16   data_page_size;    /* 每页大小(通常 4KB)*/
    __u16   data_page_order;   /* 页数 = 2^order */
    ……
};
然后来看ring buffer结构体的信息。misc 字段的位含义:
| 位 | 宏 | 含义 |
| :– | :————————– | :————— |
| 0 | PERF_RECORD_MISC_KERNEL | 采样发生在内核态 |
| 1 | PERF_RECORD_MISC_USER | 采样发生在用户态 |
| 2 | PERF_RECORD_MISC_OVERFLOW | 由计数器溢出触发(非软件注入) |
| 3 | PERF_RECORD_MISC_SWITCH | 上下文切换时采样 |
| 4-7 | PERF_RECORD_MISC_CPU_MASK | CPU 编号(多 CPU 区分) |
Linux 内核 perf 子系统定义的所有记录类型,位于 include/uapi/linux/perf_event.h, type字段的含义:
| 枚举 | 值 | 含义 | 触发时机 |
| :———————– | :—- | :———— | :——————————— |
| PERF_RECORD_MMAP | 1 | 进程内存映射 | exec()/mmap() 执行可执行文件 |
| PERF_RECORD_LOST | 2 | 采样丢失通知 | ring buffer 满,无法写入 |
| PERF_RECORD_COMM | 3 | 进程名/线程名变更 | exec()/prctl(PR_SET_NAME) |
| PERF_RECORD_EXIT | 4 | 进程退出 | 进程终止 |
| PERF_RECORD_THROTTLE | 5 | 采样节流开始,频率过高警告,可用于统计降速次数 | 频率超过 perf_event_attr.sample_freq |
| PERF_RECORD_UNTHROTTLE | 6 | 采样节流结束 | 频率恢复,可用于统计恢复落 |
| PERF_RECORD_FORK | 7 | 进程 fork | fork() 创建子进程 |
| PERF_RECORD_READ | 8 | 计数器读值 | 显式 read() 系统调用 |
| PERF_RECORD_SAMPLE | 9 | 采样记录(最常用) | PMU 计数器溢出 |
| PERF_RECORD_LOST_SAMPLES | 13 | 采样丢失计数 | 用于精确统计丢了多少条
#define PERF_RECORD_MISC_KERNEL          (1 << 0)
#define PERF_RECORD_MISC_USER            (1 << 1)
#define PERF_RECORD_MISC_OVERFLOW        (1 << 2)

// 每条采样记录以这个头开始
struct perf_event_header {
    __u32   type;      /* PERF_RECORD_* 枚举 */
    __u16   misc;      /* 标志位 */
    __u16   size;      /* 整个记录的字节数(含头)*/
};

struct perf_buffer {
    /* --- 引用与归属 --- */
    struct perf_event *event;       /* 反向指针 */
    atomic_t refcount;              /* 引用计数(多事件共享时用)*/

    /* --- 内存布局 --- */
    void **data_pages;              /* 数据页指针数组 */
    struct perf_event_mmap_page *user_page;  /* 头页(与用户共享)*/

    /* --- 页管理 --- */
    int nr_pages;                   /* 数据页数量(2的幂)*/
    int nr_pages_locked;            /* 已锁定的页数 */
    int page_shift;                 /* 页大小 = 1 << page_shift */

    /* --- 读写控制 --- */
    local64_t head;                 /* 内核本地缓存的 head */
    local64_t lost;                 /* 丢失的采样数(buffer满时)*/

    ……
};
一条记录长相如下:
┌─────────────────────────────────────────┐
│  struct perf_event_header (8 bytes)     │
│    type  = PERF_RECORD_SAMPLE (0x9)     │
│    misc  = 标志位                        │
│    size  = 总长度(如 72)               │
├─────────────────────────────────────────┤
│  采样数据(紧接头后,大小 = size - 8)    │
│                                         │
│  具体内容由 attr.sample_type 决定:       │
│                                         │
│  PERF_SAMPLE_IP        →  u64 ip        │  指令指针
│  PERF_SAMPLE_TID       →  u32 pid, tid  │  进程/线程号
│  PERF_SAMPLE_TIME      →  u64 time      │  时间戳
│  PERF_SAMPLE_ADDR      →  u64 addr      │  数据地址 ◄── 你的 ae->addr
│  PERF_SAMPLE_ID        →  u64 id        │  事件 ID
│  PERF_SAMPLE_STREAM_ID →  u64 stream_id │
│  PERF_SAMPLE_CPU       →  u32 cpu, res  │
│  PERF_SAMPLE_PERIOD    →  u64 period    │  采样周期
│  PERF_SAMPLE_READ      →  计数器组值    │
│  PERF_SAMPLE_CALLCHAIN →  栈回溯        │
│  PERF_SAMPLE_RAW       →  原始 PMU 数据 │
│  ... 等等                               │
│                                         │
└─────────────────────────────────────────┘
文件描述符和ring buffer的关联:通过 file->private_data 找到 event 再找到 rb,检查 data_head/tail.
fd (用户态)
  ↓ sys_read/sys_poll/sys_mmap
struct file (VFS 层)
  ↓ file->private_data
struct perf_event
  ↓ event->rb
struct perf_buffer
  ↓ rb->user_page / rb->data_pages
物理页框(与用户态共享)